[https://fred.stlouisfed.org/series/CIVPART](https://fred.stlouisfed.org/graph/graph-landing.php?g=16nZq&width=670&height=475)
https://fred.stlouisfed.org/series/CIVPART

https://www.bls.gov/opub/reports/race-and-ethnicity/2021/home.htm#:~:text=The labor force participation rate was 74.7 percent and 69.9,and Whites (56.4 percent).
Total Civilian Non-Institutional Population
Total Civilian Labor Force
Total Employed
— Full Time Employed
Total Unemployed
Not in Labor Force
— Retired
— Ill or Disabled
— Going to School
— Taking care of family
266.6 million
166.8 million
160.7 million
*130 million (81%)*
6 million
100 million
— 45 million
— 19 million
— 18 million
— 15 million
Men Population Over 20 years old in the Labor Force: 85.5 million, 70% participation rate
Women Population Over 20 years old in the Labor Force: 75 million, 59% participation rate
Of the 100 million not in the labor force, about 93% are not interested in having a job, and 7% do want a job but have stopped searching in the past four weeks.
Among those not working, the largest reason is retirement, as can be seen here in the proportion of those not in the labor force by age:

https://eyeonhousing.org/2017/01/who-is-not-in-the-labor-force/
Overall, 45% report they are not in the labor force due to retirement, 19% because of illness or disability, 18% are going to school, and 15% are taking care of home or family.

https://eyeonhousing.org/2017/01/who-is-not-in-the-labor-force/https://eyeonhousing.org/2017/01/who-is-not-in-the-labor-force/
Of those in prime working age, ages 16-64, top reasons are going to school, illness or disability, and taking care of home or family:

The Unemployment rate for Black job seekers is twice as high as white job seekers

https://www.bls.gov/opub/reports/race-and-ethnicity/2021/home.htm#:~:text=The unemployment rate averaged 8.6,was 6.8 percent for Hispanics.
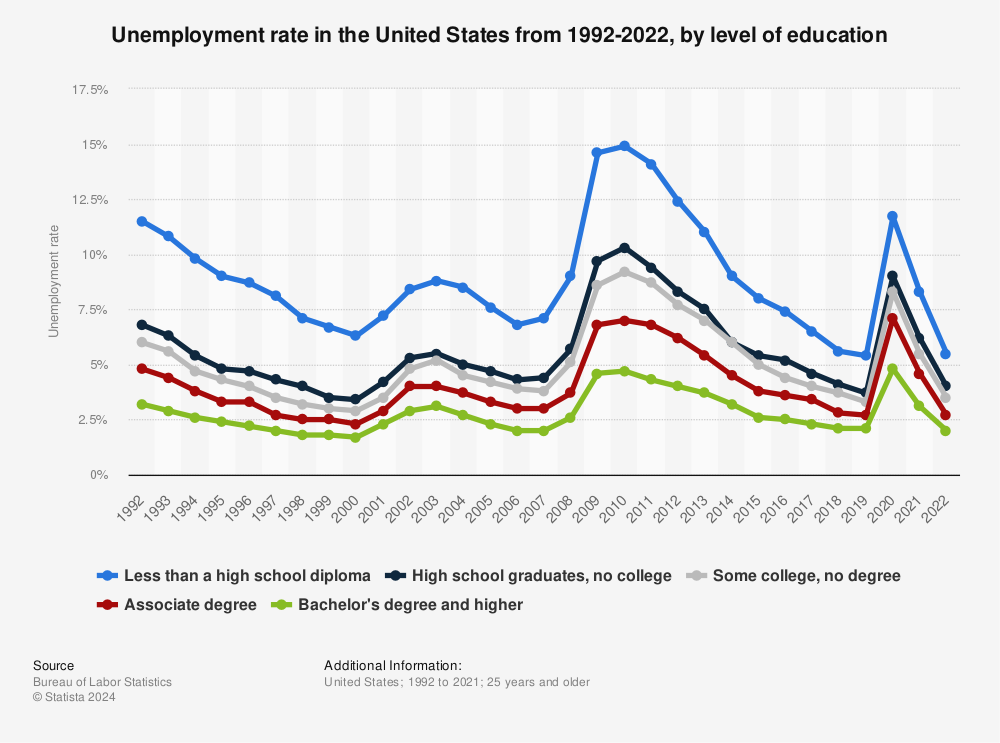
Those with a high school degree have twice as high unemployment rates than compared to those with a bachelor’s degree.

https://www.statista.com/statistics/232942/unemployment-rate-by-level-of-education-in-the-us/

https://www.bls.gov/opub/reports/race-and-ethnicity/2021/home.htm#:~:text=The labor force participation rate was 74.7 percent and 69.9,and Whites (56.4 percent).
Underemployment is rising as education attainment grows. As the Bureau of Labor Statistics wrote in 2014, “The underemployment rate for new college graduates has risen substantially since 2000, with a growing number of graduates accepting jobs that are part time or low paying jobs or both. Steadily rising, the underemployment rate for recent graduates increased from 34 percent in 2001 to 44 percent by 2012.”
An in-depth study from Burning Glass and Strada in 2018 finds that 43% of graduates’ first job is one that doesn’t require a bachelor’s degree, and leaves them underemployed. After five years, 35% of graduates are underemployed, and after ten years, 32% are underemployed.

https://www.burning-glass.com/wp-content/uploads/permanent_detour_underemployment_report.pdf
Major Matters: The same report finds that certain majors have higher rates of underemployed graduates.

Occupation Matters, Too
Just as certain majors have an employment edge, the fields in which graduates land their first job have strong bearing on their long-term career prospects.
